Lessons learned from Black Ops Testing - Testing a JavaScript library
Introduction
James Lyndsay suggested JS-Sequence-Diagrams as a target for Black Ops Testing.
I’m a big fan of “text to diagram” and “text to document” systems so I was hoping this would result in a good target. And it did.
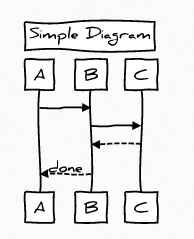
If you haven’t seen a “text to diagram” type system before then it basically takes text like:
Title: Simple Diagram
A->B:
B->C:
C-->B:
B-->A: done
And creates a diagram:
I often use Graphviz for this type of process since I tend to create more generic diagrams, but if you want to use Sequence Diagrams then JS-Sequence-Diagrams offers a simple grammar and effective output.
For the Black Ops Testing webinars, the nerve wracking thing about testing these small systems, concerns:
- is it rich enough?
- will we find enough?
- will it illustrate enough thought processes and approaches?
And this library was, and we did, and it could.
JS-Sequence-Diagrams describes itself as “A simple javascript library to turn text into vector” diagrams. So it presents its self as a library.
Testing a library offers challenges for interactive testing, because you need something to wrap the library to make it usable: code, or a GUI of some form.
Fortunately JS-Sequence-Diagrams has several GUIs to offer us:
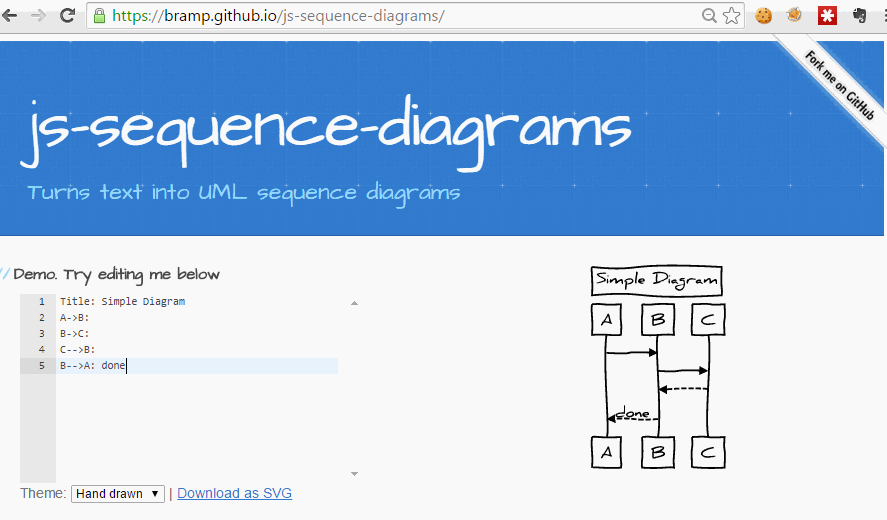
- The text editor input on the demo page JS-Sequence-Diagrams
- A test.html file in the source code
Since the demo page is available, I started my testing with that.
Do look yourself
You might want to have a quick look at the page and see what you think and find before continuing, otherwise you risk my notes impacting your ability to view the library and demo page without bias.
Go look now: JS-Sequence-Diagrams
> WAIT
You wait.
Time Passes...
Gandalf opens the round green door.

> WAIT
You wait.
Time Passes...
Gandalf goes east.

> WAIT
You wait.
Time passes...

> WAIT
You wait.
Time passes...
Thorin waits.

> WAIT
You wait.
Time passes...
Thorin says " Hurry up ".
Initial Thoughts
I looked at the demo page JS-Sequence-Diagrams and made a few notes on what it was built with and what other libraries in use. My initial thoughts were:
- Use as a tool interactively, with default page
- Use as a library
- Explore configuration scope by using tool interactively with a different set of library components e.g. Raphael, lodash, no JQuery
- JS Heavy so risk of JS Compatibility errors
- Run and review the QUnit to identify coverage gaps and risks
- Create a new GUI page to control loaded components and minimise risk of custom editor interaction obscuring bugs or impacting testing
- compare ‘standard’ for sequence diagrams against implementation
You can see that I have identified some risks:
- JS compatibility
- Demo page has a JS editor which might conflict
- Demo page might obscure testing
And I could also try and use the tool as a library.
Initial Interactions
My first few attempts at creating a simple diagram triggered an error because I found that some of the characters I was using were not allowed.
NOTE:
- “,” is not allowed in an actor name
- “-” is not allowed in an actor name
- “:” and “>” are not allowed in an actor name
I also found that some of the characters were only rendered in the ‘simple’ view, and not in the hand-drawn view. i.e.
- ¦
So I made a note to my future self to explore character sets and see what would render and what would not.
I also wanted to find a way of minimising the impact of the editor in my testing. i.e if I found a bug, how would I know that it was a bug in the library and not a bug in the editor or the interaction between the library and the editor?
Interacting with the library without any harness
We already have all the code we need in the browser, after the demo site has loaded, to interact with the library directly. As a JavaScript library, it has already loaded into the DOM, so if we open up the developer console and type:
Diagram.parse("Eris->Bob:").drawSVG($('#demo').find('.diagram').get(0));
We will see the diagram visualising the above relationship in the browser. So we really don’t need a harness or a framework to create simple interactions with the library. And we know that we can bypass the GUI if we need to.
I don’t know how many testers do actually use the developer console to interact with the JavaScript in the applications they test, but I find it a useful skill to have. And it requires a reduced level of JavaScript knowledge required to do this, than it does to code a JavaScript application, so you can get started with this pretty quickly.
Time Passes
You can see the scope of testing I ran through in the associated notes.
This post is to describe at a higher level, some of the lessons learned and approaches taken rather than drop down and explain all the issues found and tests executed.
I made notes of the issues I found, but I realised after a while, that I should really have a small example for each issue which demonstrated the issue. And this tool is perfect for this since an issue description will have text, I can embed the text of the diagram in the issue.
So I revisited all the issues I found and added examples for each.
Cross Browser
I then realised, that I could take all the examples I had and check them against different browsers, if only I had a page that I could load into each browser that would render the different examples.
So I set about building an html page that I could add each of my examples to, and have them render on loading. I guess this could be called a cross browser testing tool, specific to this particular library.
I wanted something where I could add each of the diagram text files without too much editing, and without any additional coding each time I added an example.
So, despite my JavaScript skill not being the best in the world I interactively built up a single page where I could add all my examples in the form of:
<textarea class="exampleSource">
Title: Issue: char "\" represented a "/" in hand drawn
actor name but backslash "\" in simple
\->A:
</textarea>
Then I have JavaScript at the bottom of the file which, when the page is loaded, finds all those textarea blocks and, using a template I have in the html file, adds them to the DOM. They are then rendered using both the simple and the hand drawn versions.
I also made the template show the diagram source to make it easy to copy and paste into an interactive GUI if I needed, and act as documentation.
So not only do I have a page that I can load into any browser and check for compatibility, I don’t need to do anything special to explore the two rendering options.
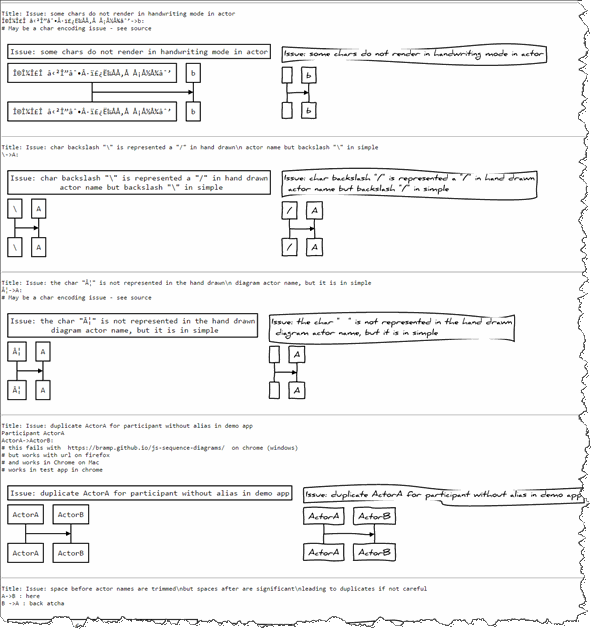
When I viewed my examples on the page I realised that I needed to use the title attribute more effectively to describe if the diagram was an ‘Issue’ or an ‘Example’.
This made the page easier to scan and more self descriptive.
By loading this page I could also see that one of the issues I had found, did not appear here, but it did appear when the example was used interactively in the demo gui.
Title: Issue: can not mix alias and name in same diagram
Participant ActorA as A
A->ActorB:
ActorA->ActorB:
I had evidence that the risk that I identified early regarding possible impact of the JS editor with the drawing library, had actually manifested.
Subsequent investigate with Steve and James revealed that, interactively:
- this error didn’t manifest in Firefox
- this error only manifested in Chrome
- and only manifested in Chrome on Windows, not on Mac
So, in addition to being an editor interaction issue, it was also a cross browser issue.
When testing, we have to make a call regarding how far do we diagnose a problem. I did not diagnose the problem any further than this - so I don’t know what causes it. I suspect it is probably a line endings issue, but will leave additional investigation up to the development team, should they consider this worth fixing.
Interactive Testing
The test.html file in the source, allows interactive testing without a risk of the JS editor impacting the library because it uses a simple text area as input.
I decided to use this for interacting with the library.
But, rather than download all the js files and store them relative to the test.html file, as the current implementation required I wanted to pick up the relevant libraries from a cdn, that way I could switch them out easily and I wouldn’t have to have much setup on my local machine.
I discovered that the JavaScript eco system has a centralised approach to this - much like maven in Java - via cdnjs.com, so I used this as the source for the libraries in the code.
I then incrementally amended the test.html code such that it:
- rendered both simple and hand drawn graph versions
- reported any syntax errors on screen
- doesn’t require JQuery (since that is documented as optional on the main library page)
- maintains a history of non-syntax error diagrams in the page to easily see what testing I did and maintain a record - I can save the page as a .html file to retain a ‘record’ of my testing session
I did not put the effort in, to make my code cross browser, so this had incompatibilities on IE that I didn’t attempt to fix. It also had bugs on Firefox, that I didn’t realise until Steve tried to use it in his testing. (Note: I have now amended explorer.html to work on Firefox and IE and Chrome).
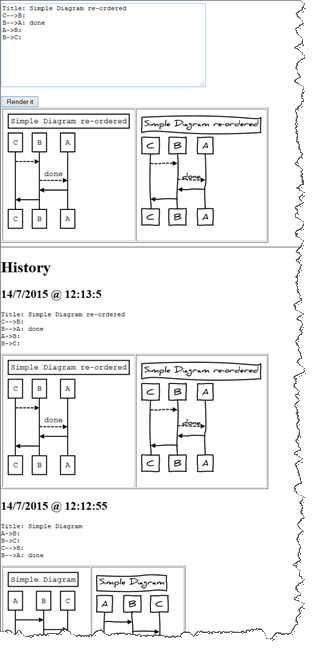
Again, this didn’t require great JavaScript skills. I built it incrementally, and cannibalized code from the demo page and the test.html page.
- What else would you have added if you were interactively testing this library?
- Feel free to amend the code to add those features and see how you get on.
Essentially, I crafted two tools to help me report on my testing and interact with the library.
Cross Browser Testing
As I was testing the library, a tool came through my newsfeed that I had not encountered or used before:
This claims to be a single GUI where you can run multiple browsers for cross browser testing.
I’m generally suspicious of these types of tools, but I did not want to appear churlish and risk the wrath of Earth Coincidence Control Office.
According to the developers, BrowseEmAll uses the browser ’embedded’ mode, so use the same rendering engines and JavaScript engines as the browsers, although the developer tools are different.
Interestingly they have a WebDriver implementation for it, which is still in early stages, but might be a useful add-on to any existing local grid setup for supporting cross browser testing with early versions of the rendering engines. Rather than maintain a grid of lots of old versions. I have yet to try this however.
I haven’t used BrowseEmAll enough to convince myself that I could use it in preference to actual browsers, but it did allow me to side-by-side demonstrate that the interactive issue I found earlier was only in Chrome, and not in Firefox.
On my notes
You can see different versions of my notes:
I tend to write most of my notes in markdown format now, so even in evernote, I write in markdown. I can then feed this through a markdown formatter like dillinger.io to generate pdf or html
Markdown is essentially a “text to document” process, where I write in pure text, and then another system parses the format and outputs html or pdf.
In Evernote, I write in markdown, but I also have the ability to add images without thinking about it. This allows me to add ‘comments’ into my text which don’t appear in the final output.
This is also why I like the “text to diagram” systems. I can embed meta-data in the form of comments, this information is not rendered, but is useful for a human reading the text later.
In the past I’ve used Graphviz on site to document information I’ve received and I add comments into the Graphviz file for where I found the information, todos, gotchas, risks etc. none of this appears in the rendered image, but is very useful for me to build a model of the system I’m working with.
I do the same thing in the examples for js-sequence-diagram
Title: This creates a duplicate ActorA
Participant ActorA
ActorA->ActorB:
# this fails with
# https://bramp.github.io/js-sequence-diagrams/
# on chrome on windows
# but works with url on firefox
# works in test app in chrome
# works in chrome on mac
Where the comments above provide meta data about the issue regarding replication. I also use the features of the tool to help me.
And if you find this issue in the Evernote pdf you will also see that I’ve added a screenshot, which was for my information, rather than the markdown.
I particularly like the “text to X” approach because it allows for:
- version control
- diffing between versions
- meta data and comments in the source which are not in the render
- instantly at least 2 visualisations of the model (text, render)
- often multiple visualisations with rendering parameters, which can help you see the model from a slightly different perspective e.g. different layout rules help spot different spatial relationships
Summary
Again, a surprising amount of opportunity for reflection on ‘how to approach’ something that, at a surface level, seems very simple.
I hardly touched my initial set of options about how to approach testing so there still remains a lot that I could continue to pursue with the testing of this library. And if you watch the webinar that this text relates to, you will see how differently James, Steve and Tony approached the topic.
And you can find an outline summary of my lessons learned below:
- Library execution from console
Diagram.parse("A->B:nB->C:").drawSVG($('#demo').find('.diagram').get(0));
- Markdown notes writeup
- Can read as .txt
- Can easily convert to pdf via dillinger.io
- Images embedded within text are not rendered (possibly good for adhoc image tracking)
- like a text to diagram, a text to document allows embedded comments (images, html comments <!- this won’t be seen -> )
- Tool as documentation
- since the diags support # as a comment we can use that to our advantage when documenting the testing or raising defects e.g. urls, environment, versions - all stored in the diagram txt
- Use the title as the issue name or test ideal
- Create minimal source to recreate the issue and embed in defect report
- Text to diagrams
- Fast to create, autolayout
- Can tweak for ‘better’ layout e.g. n, aliases and naming
- Learn the nuances of the tool
- Version control and compare previous versions
- Easier to auto generate the diagram source than a diagram equivalent
- Use the ‘comments’ functionality for meta data and notes
- Human readable at text, visual a different ‘view’
- Environment Control important - see the cross browser (Chrome/Firefox Participant issue)
- What version is the demo site running?
- Does the editor interfere? Cross-Browser Risk
- Tester has different view of tool support required from testing
- compare test.html with “explorer.html”
- shows both simple/hand graph at same time
- tracks history of usage
- minimal libraries to avoid risk of interference
- (but mine is buggy on IE because I don’t know JS as well)
- display parse errors on screen
- Cross browser testing
- testing what? GUI, Rendering, Parsing?
- Observe, Interrogate, Manipulate
- Console
- JS Debugger - harder with minimised code (use pretty print in console)
- Network Tab
Links:
- Webinar write up and replay on BlackOpsTesting.com
- My notes and tools released to github
- js-sequence-diagrams demo page with links to the github repo

